“Sometimes it's a bit like detective work”
Interview with Eric Maercker from Energy Management
2024/01/23
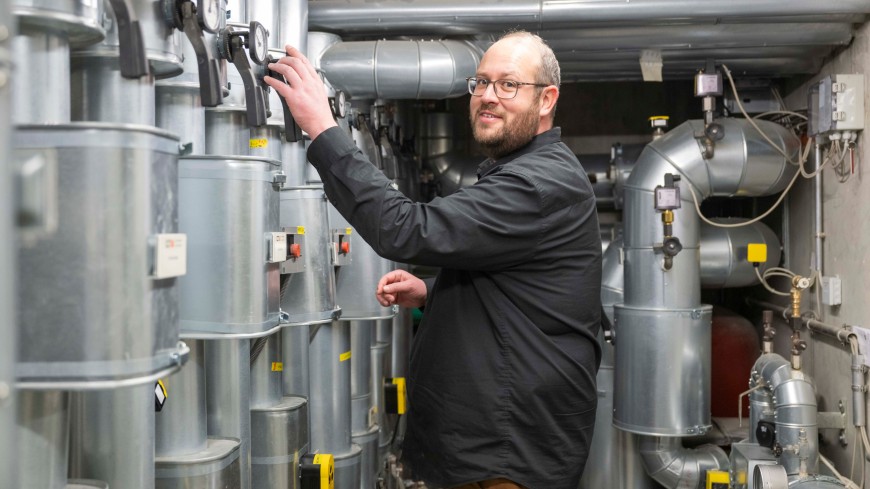
Eric Maercker is working on reducing the TU's energy consumption and paving the way for a CO₂-neutral university. In an interview, the 39-year-old explains, among other things, how the TU is supplied with energy and what his most urgent tasks are at the moment.
TU Darmstadt: The Energy Management department has been around since 2010, what has changed since the energy crisis?
Eric Maercker: Heat and electricity used to be cheap and not a problem. Since climate change has become more and more obvious, the topic of energy saving and energy management has reached the center of society. Awareness and requirements have also increased at TU Darmstadt. The energy crisis has further accelerated the processes. The university's savings targets for the winter of 2022/23 were 15 percent for weather-related heat and five percent for electricity.
We actually used 23 percent less heat and around ten percent less electricity. Similar savings targets have been set for the current winter: 15 percent for heat, five percent for electricity plus two million euros in savings on energy costs. This is a mix of consumption-oriented and monetary targets. Overall, it can be said that energy management has gained in importance at the TU. This can also be seen in the size of the department. We currently have five colleagues, with another engineer joining us in March. Then there will be six specialists dealing with the topic.
What areas does energy management cover?
On the one hand, it is about ensuring a secure energy supply for the TU. However, the basics of active energy management also include knowing and analysing exactly where which energy is consumed in the university and, for example, investigating which plant technology is possibly oversized in operation and can be optimized for savings. The aim is also a detailed CO2 balance and monitoring. We maintain an interdisciplinary exchange for all of these tasks and also work together with research projects such as the “EnEff Campus Lichtwiese”.
Energy management is the central building block of the energy transition at the TU, and we are on the right track.
How does the TU's current energy supply work?
The combined heat and power plant on the Lichtwiese campus supplies over 90 percent of the university buildings with district heating and electricity. Over 100 buildings on the Lichtwiese campus, at the Botanical Gardens and in the city center are connected to this network. However, most of the district heating is produced using gas, and we need to think about how the TU can become CO₂-neutral. The Energy Management department is drawing up a transformation plan for this. It is still unclear whether the combined heat and power plant can be operated with hydrogen in the future.
That would be an elegant way to switch energy sources. We are currently working on feeding in more renewable energy. For example, energy from our only photovoltaic system to date, which was installed on the Lichtwiese. A further 16 systems are planned at the TU by 2025. We are also already using the waste heat generated by our high-performance computer “Lichtenberg II” on campus, for example. In the long term, there are also plans to reduce the temperature of the district heating in order to save energy and emissions. To achieve this, however, the buildings also need to be renovated in terms of energy efficiency. Energy management is the central building block of the energy transition at the TU, and we are making good progress.


Do you visualize energy consumption in daily graphs on the TU homepage?
Yes, the current heat and electricity consumption for the day can be viewed on the TU website. The forecasting model was developed by Mario Beykirch, M.Eng., from the EINS department under the supervision of Professor Florian Steinke. The graphs show the daily aggregated total consumption of electrical energy and heating energy compared to the previous year.
The sum of all energy consumption is shown, but not the consumption of individual buildings. Within the TU, the heat data can also be viewed at building level. The red line shows the actual heat consumption of the day, the blue line the expected consumption based on a regression model. The distances between the lines clearly show the savings achieved by the university. In this way, we want to make the effectiveness and results of the energy-saving measures transparent.
Improving the meter infrastructure is one of your current urgent tasks?
The aim is to expand the metering infrastructure by 2026. In order to identify potential savings, it is important to know how much energy is being consumed where and why in the university. We currently receive data on heat consumption in our buildings every 15 minutes via remotely read meters from our energy suppliers, which enables us to make precise calculations. Initially, however, we did not have any building-specific measurements for electricity consumption.
Readings were often only taken at the beginning and end of the year, sometimes by hand and not digitally. The information on annual consumption was too rough. The meter infrastructure at the TU is very different. On the Lichtwiese campus, it has now been upgraded as part of the “EnEff Campus Lichtwiese” research project, and we can now make good statements about heat and electricity consumption. There is still a great need for retrofitting on the Stadtmitte campus. Around 60 buildings there have old meters or no meters at all. This is where the need for action is greatest.
The energy management system is based on software. What is it like to work with it?
The daily data volume is enormous. This includes the daily report of the 15-minute readings from the data loggers, as well as historical data and manual or digital meter readings. We take a close look at these reports every day and I make sure that the quality of the data is reliable. You can see daily data, monthly and annual comparisons, energy output, flow rates and temperatures.
Do you recognize outliers?
Outliers occur again and again. If a meter displays unusually high values, an alarm is sent automatically. We then check whether it is a transmission or measurement error or whether there are other reasons.
We have established that 20 percent of electricity consumption is attributable to IT alone.
How do you react?
We are analyzing the reasons. At a technical university, there are naturally many research projects and test facilities. We then contact researchers and departments to find out whether there are any experiments underway that are causing unusual changes in energy consumption. It's a bit like detective work to track down the exact reason.
In general, we try to find out about all the technical systems at the TU, such as ventilation or air conditioning systems, how they work, when they run and what energy consumption they have. This enables us to make suggestions on how to optimize their operation and possibly make them more economical. In general, a change in heating (one degree less) or cooling (one degree more) can be expected to save six percent energy. That is a huge potential.
So the outliers are not the problem?
No, it's more the base load, which is enormous. We have established that 20 percent of electricity consumption can only be attributed to IT. The highest power consumer at the TU is the high-performance computer. Optimization is also possible here.
The questions were asked by Astrid Ludwig.


